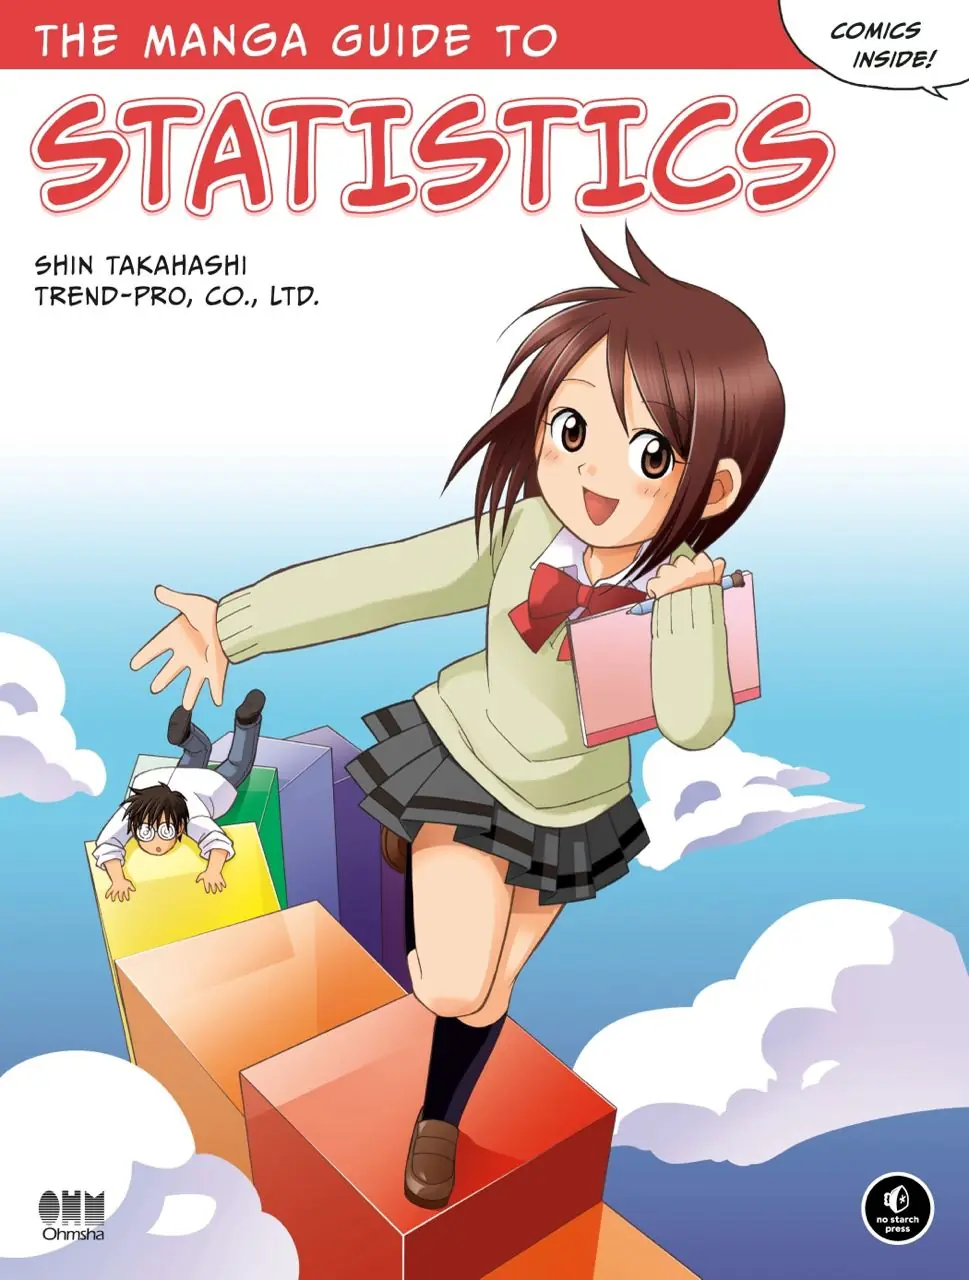
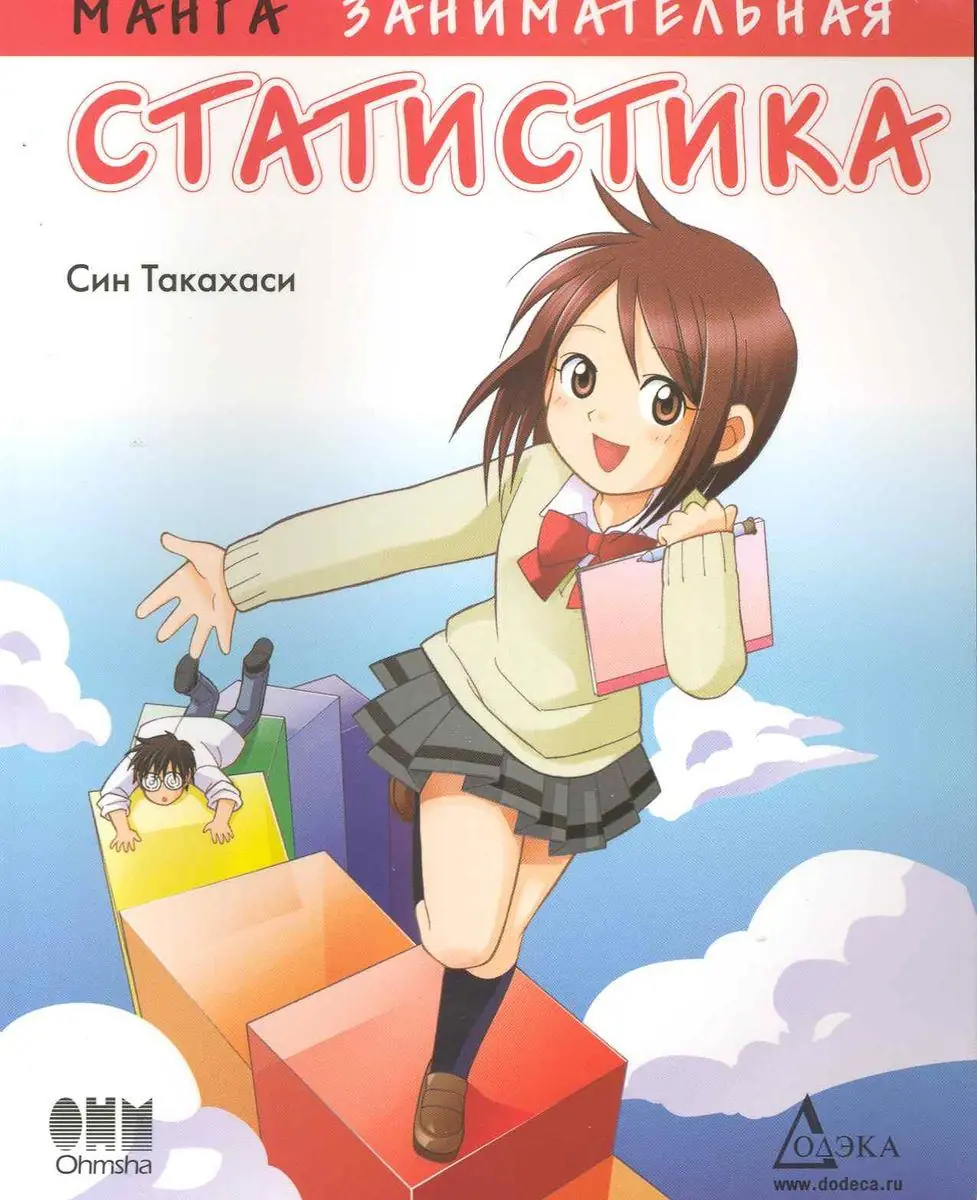
Interesting statistics. manga (The Manga Guide to Statistics)
This comic strip by Shina Takahashi was originally published 20 It contained introductory information on statistics, where it was explained on the fingers. Today I finished reading this comic book and I can say that it is good - complex topics are told in simple language on examples that are understandable to a person, which is far from statistics. Moreover, most of the above refers to the basis of what an engineer should know exactly, what is engaged in creating systems or supporting them, as well as a person from business, which formulates a roadmap for the development of products, since without this knowledge it is impossible to apply solutions based on data.
In the book of everything 7 chapters and one annex
- Let's deal with data types. Here the author talks about quantitative and qualitative data and their difference and gives examples, and then talks about the standard approach for collecting data using surveys with multivariate answers.
- Getting acquainted with quantitative data - here we are talking about distribution series, histograms, mean and median, standard deviation, evaluation theory and descriptive statistics
- Getting acquainted with quality data The author talks about simple statistical tables.
- Standardization of deviations and performance rating - This describes the approach to rationing distribution and then there is a dive into the ranking of performance (As I understand it, this is a Japanese problem with a way of assessing student performance, which uses normalized distributions.)
- Calculate the probability Here the author talks about the distribution function and the density of the distribution, then we will learn about the normal distribution. (Gaussiano) and the standard distribution. Very quickly, the author shows the distributions: chi-square, student, Fisher, but the depth is not enough for the reader to understand why they all came from and why they appeared exactly like this, but they are needed further in the narrative:)
- What can bind two variables together - three coefficients are considered here: the linear correlation coefficient (linkage)Correlation coefficient between data of different types (quantitative and qualitative)Cramer correlation coefficient (linking)
- What is the test of the hypothesis of independence? - here the most interesting topic about conducting experiments and testing hypotheses about the properties of the general population is considered. The author talks about the concept of the null and alternative hypothesis, about the p-value and the verification algorithm, and then shows how to draw conclusions based on the results of the experiment.
- Appendix - Excel basics that allow you to automate statistical calculations are discussed here.
I've already talked about several books in the same style that are devoted to statistics.
- Statistics in comics (Inroducing Statistics. A Graphic Guide)
- Statistics. A Brief Course in Comics (The cartoon guide to statistics)
- Statistics and seals
#Statistics #Math #ML #Software #SelfDevelopment #PopularScience